Our advertising partners may set these cookies on our site. These cookies enable these companies to create a profile of your interests and display relevant advertisements on other websites. They do not store personal information directly but rely on unique identifiers for your browser and internet device. Opting out of these cookies may result in less personalized advertising for you.
Data Charting and Visualization
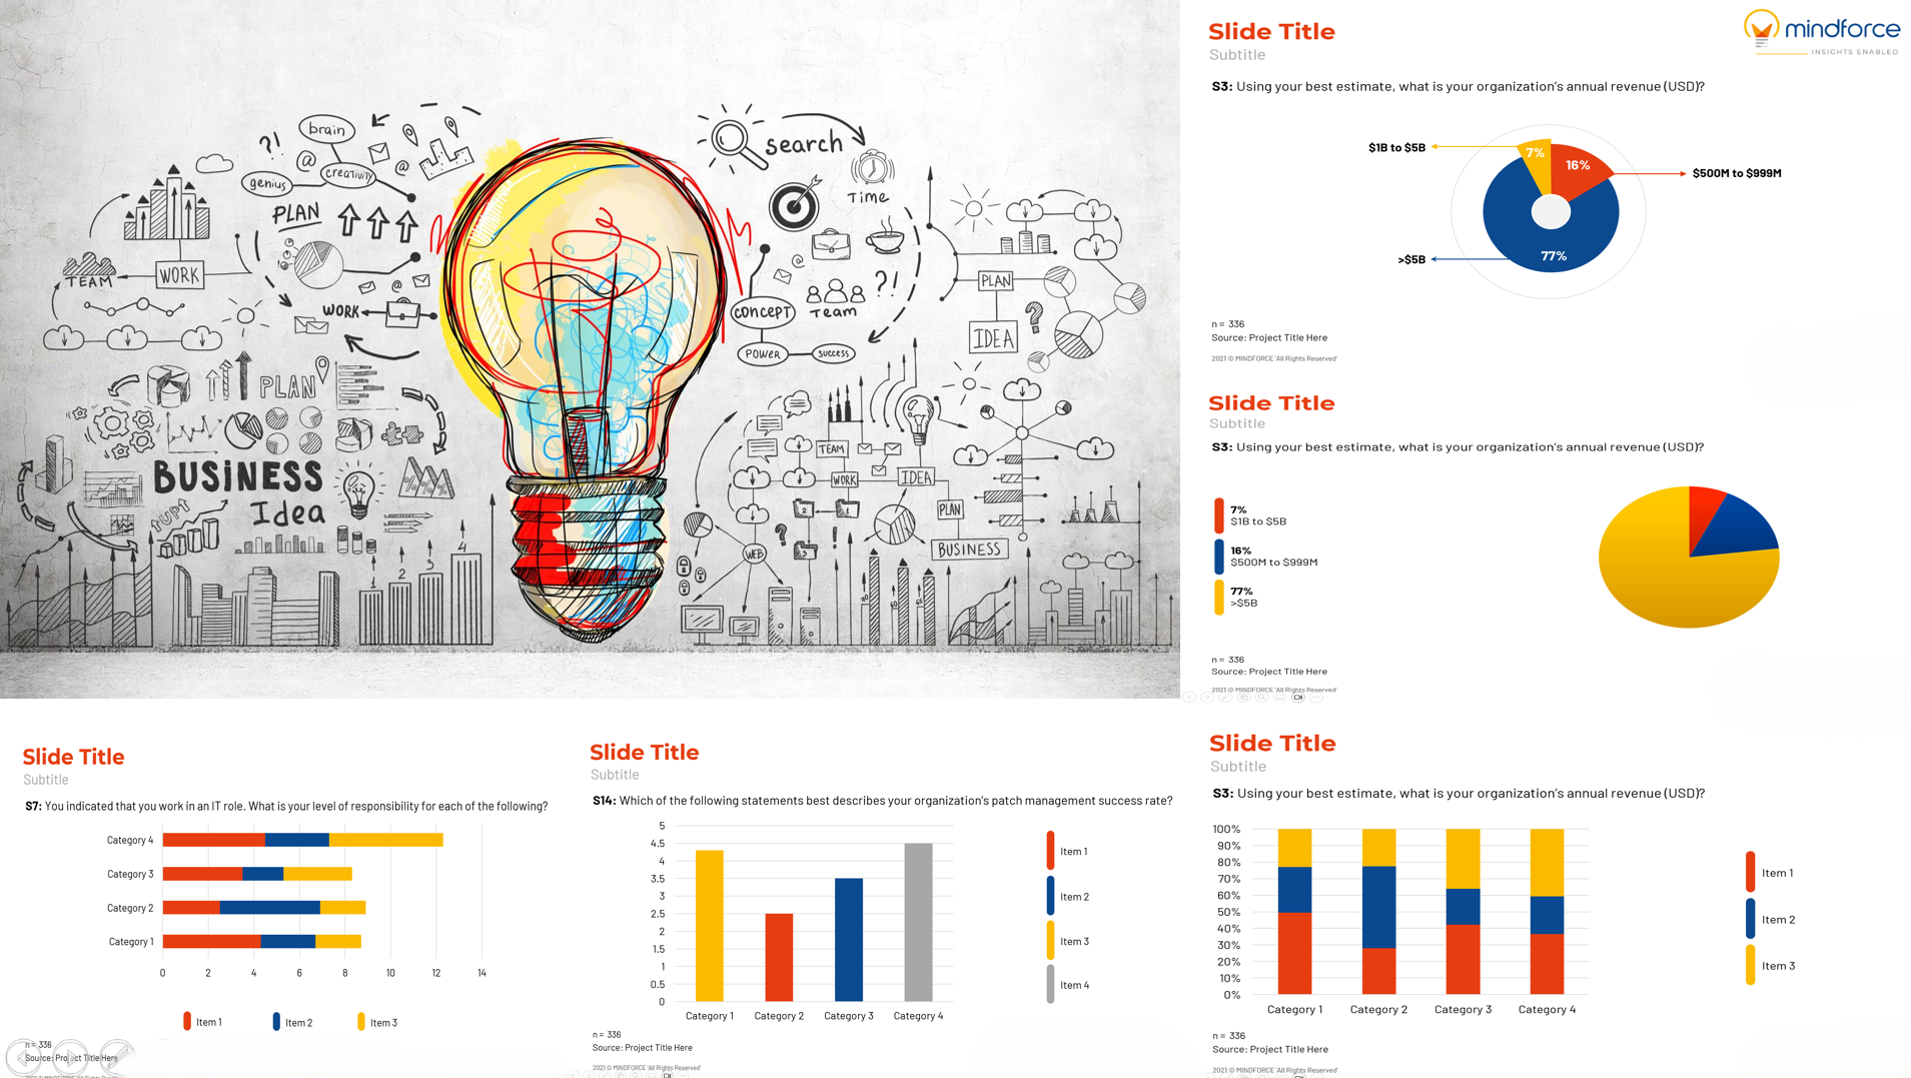
Charting services are the guiding stars of data visualization, transforming raw numbers into comprehendible insights. Whether analysing sales figures, monitoring project progress, or dissecting market trends, these services offer a visual canvas to paint the data story.
Benefits of Charting:Charts help in storytelling by visually narrating the data story. They can be used to create compelling narratives that engage audiences and convey key messages effectively.
Application of Charting Services
FAQs
What is data charting?
What is chart data?
What are data visualization charts?
What is a data type chart?
What is a data analysis chart?
What are the types of charts in data visualization?
- Bar charts: Compare categories
- Line charts: Show trends over time
- Pie charts: Show proportions
- Scatter plots: Show relationships between variables
- Histograms: Show frequency distribution
What is the data charting method?
We believe in partnering with our clients
We are keen to connect with you and discover the next big insight for you
Contact us
