High-Impact Data Visualization & Strategic Charting

Converting complex statistical outputs into decision-ready visual narratives.

Data charting visualization

Moving from a raw data table to a strategic insight isn't just about "making it look pretty." It requires an actual grasp of statistical hierarchy and significance. (Because a beautiful chart that misrepresents the 'N' count is worse than no chart at all). For a consultant, charting is the bridge between a raw finding and a concrete action. Mindforce Research handles the heavy lifting of data visualization, turning multi-dimensional sets into intuitive reports that respect methodological rigor while making sure stakeholders actually get the point.

Core Visualization Capabilities

01

Automated Reporting & PPT Population

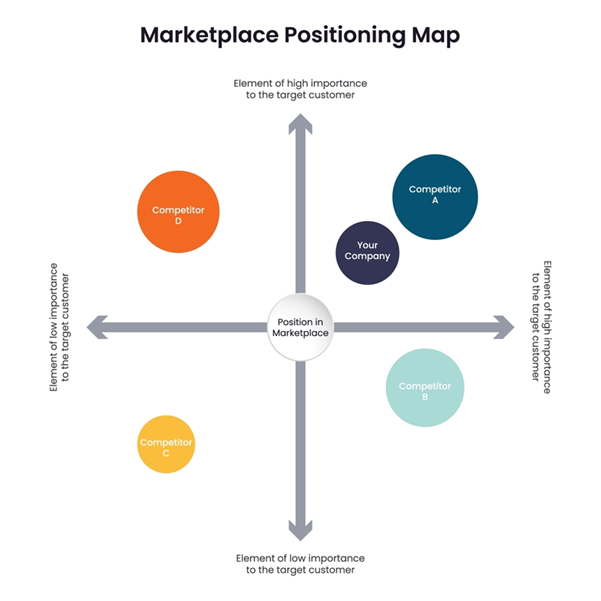
We kill the manual lag in report generation by using programmatic data-to-slide integration.

The Tech: We use E-Tabs and custom VBA/Python scripts to populate PowerPoint decks directly from SPSS or Excel. And yes, every chart stays "live" and editable so you can make those last-minute tweaks.

The Result: This massively cuts down the "time-to-insight" for big tracking studies and multi-market reports.

02

Multivariate Visualization (The Hard Stuff)

We go way beyond standard bar and pie charts. We visualize the models that actually drive strategy.

The Tech: Expert rendering of Perceptual Maps, TURF Analysis grids, Driver Analysis quadrants, and Factor Analysis clusters.

The Result: You can immediately spot market white spaces and brand positioning without digging through a 200-page tab book.

Marketplace map data charting

We use clear iconography to mark statistical significance (95% CI) right there in the visual.

03

Interactive BI Dashboards

For real-time exploration, we build dynamic dashboards that let you slice the data yourself.

The Tech: Custom builds in Tableau, PowerBI, and Dapresy. We bake in global filters, cross-tab toggles, and "drill-down" features so you can pivot by region, persona, or timeframe on the fly.

The Result: It gives your end-clients self-service analytics while keeping a single "source of truth" for the data.

04

Infographic & Narrative Storytelling

We translate dense B2B or consumer sets into "Executive Summary" visuals that highlight the KPIs that actually matter.

The Tech: We synthesize Qual-Quant hybrids, merging verbatim sentiment with hard numbers. We apply cognitive load theory to our slide design so the "Main Takeaway" is always the anchor.

The Result: You get boardroom-ready assets that don't need a designer to fix them before the meeting.

05

Tracking & Longitudinal Visualization

Visualizing change over time is risky if you don't respect scale and baseline consistency.

The Tech: We create Trend-Line overlays with rolling averages and period-over-period variance indicators. We ensure historical data is anchored correctly so new waves don't skew the visual story.

The Result: [Insert Personal Anecdote Here]. It lets you identify market shifts and the impact of brand interventions immediately.

06

Data Integrity & QA in Charting

Every chart we ship is back-checked against the raw tables. No exceptions.

The Tech: A Dual-Validation Protocol where a second data analyst audits every visual output. We verify that N-counts, bases, and weighted percentages align perfectly with the Final Tabulation plan.

The Result: It protects your reputation. Every chart in your deck is statistically defensible.

Our Visualization Stack

We use a professional suite of tools to hit global consulting standards:

Visualization stack tools
The Core: Advanced Microsoft PowerPoint, Adobe Illustrator, Tableau, and PowerBI.
Bespoke Templates: We develop custom templates that match your firm's specific brand guidelines and charting style.
Statistical Overlays: Automated significance markers (ABC/abc) and standard error bars are integrated into every visual by default.

Turn Your Data into a Strategic Narrative.

Partner with Mindforce Research for data charting that merges analytical precision with high-impact design.

Hi! Hope you are having a good day!

Can you please help us with your query, name, email id and contact number with country code? Our support Agent will get back to you on mail.

now