Interactive dashboards and dynamic insights ecosystems

Making environments for real-time, multi-source data that can be used for long-term tracking and tactical decision-making.

Interactive dashboard ecosystem

A static PDF usually doesn't work in a fast-moving market. A dashboard isn't just a "view" into data for a consultant; it's a strategic tool that turns raw survey numbers into a constant flow of information. At Mindforce Research, we build custom dashboards that bring together different data sources, like primary research, CRM, and social telemetry, into one easy-to-use interface. (We all know that no one has time to log into five different platforms to find one KPI.) Our solutions let you do deep-dive exploratory analysis without losing statistical accuracy.

Main Dashboarding Features

01

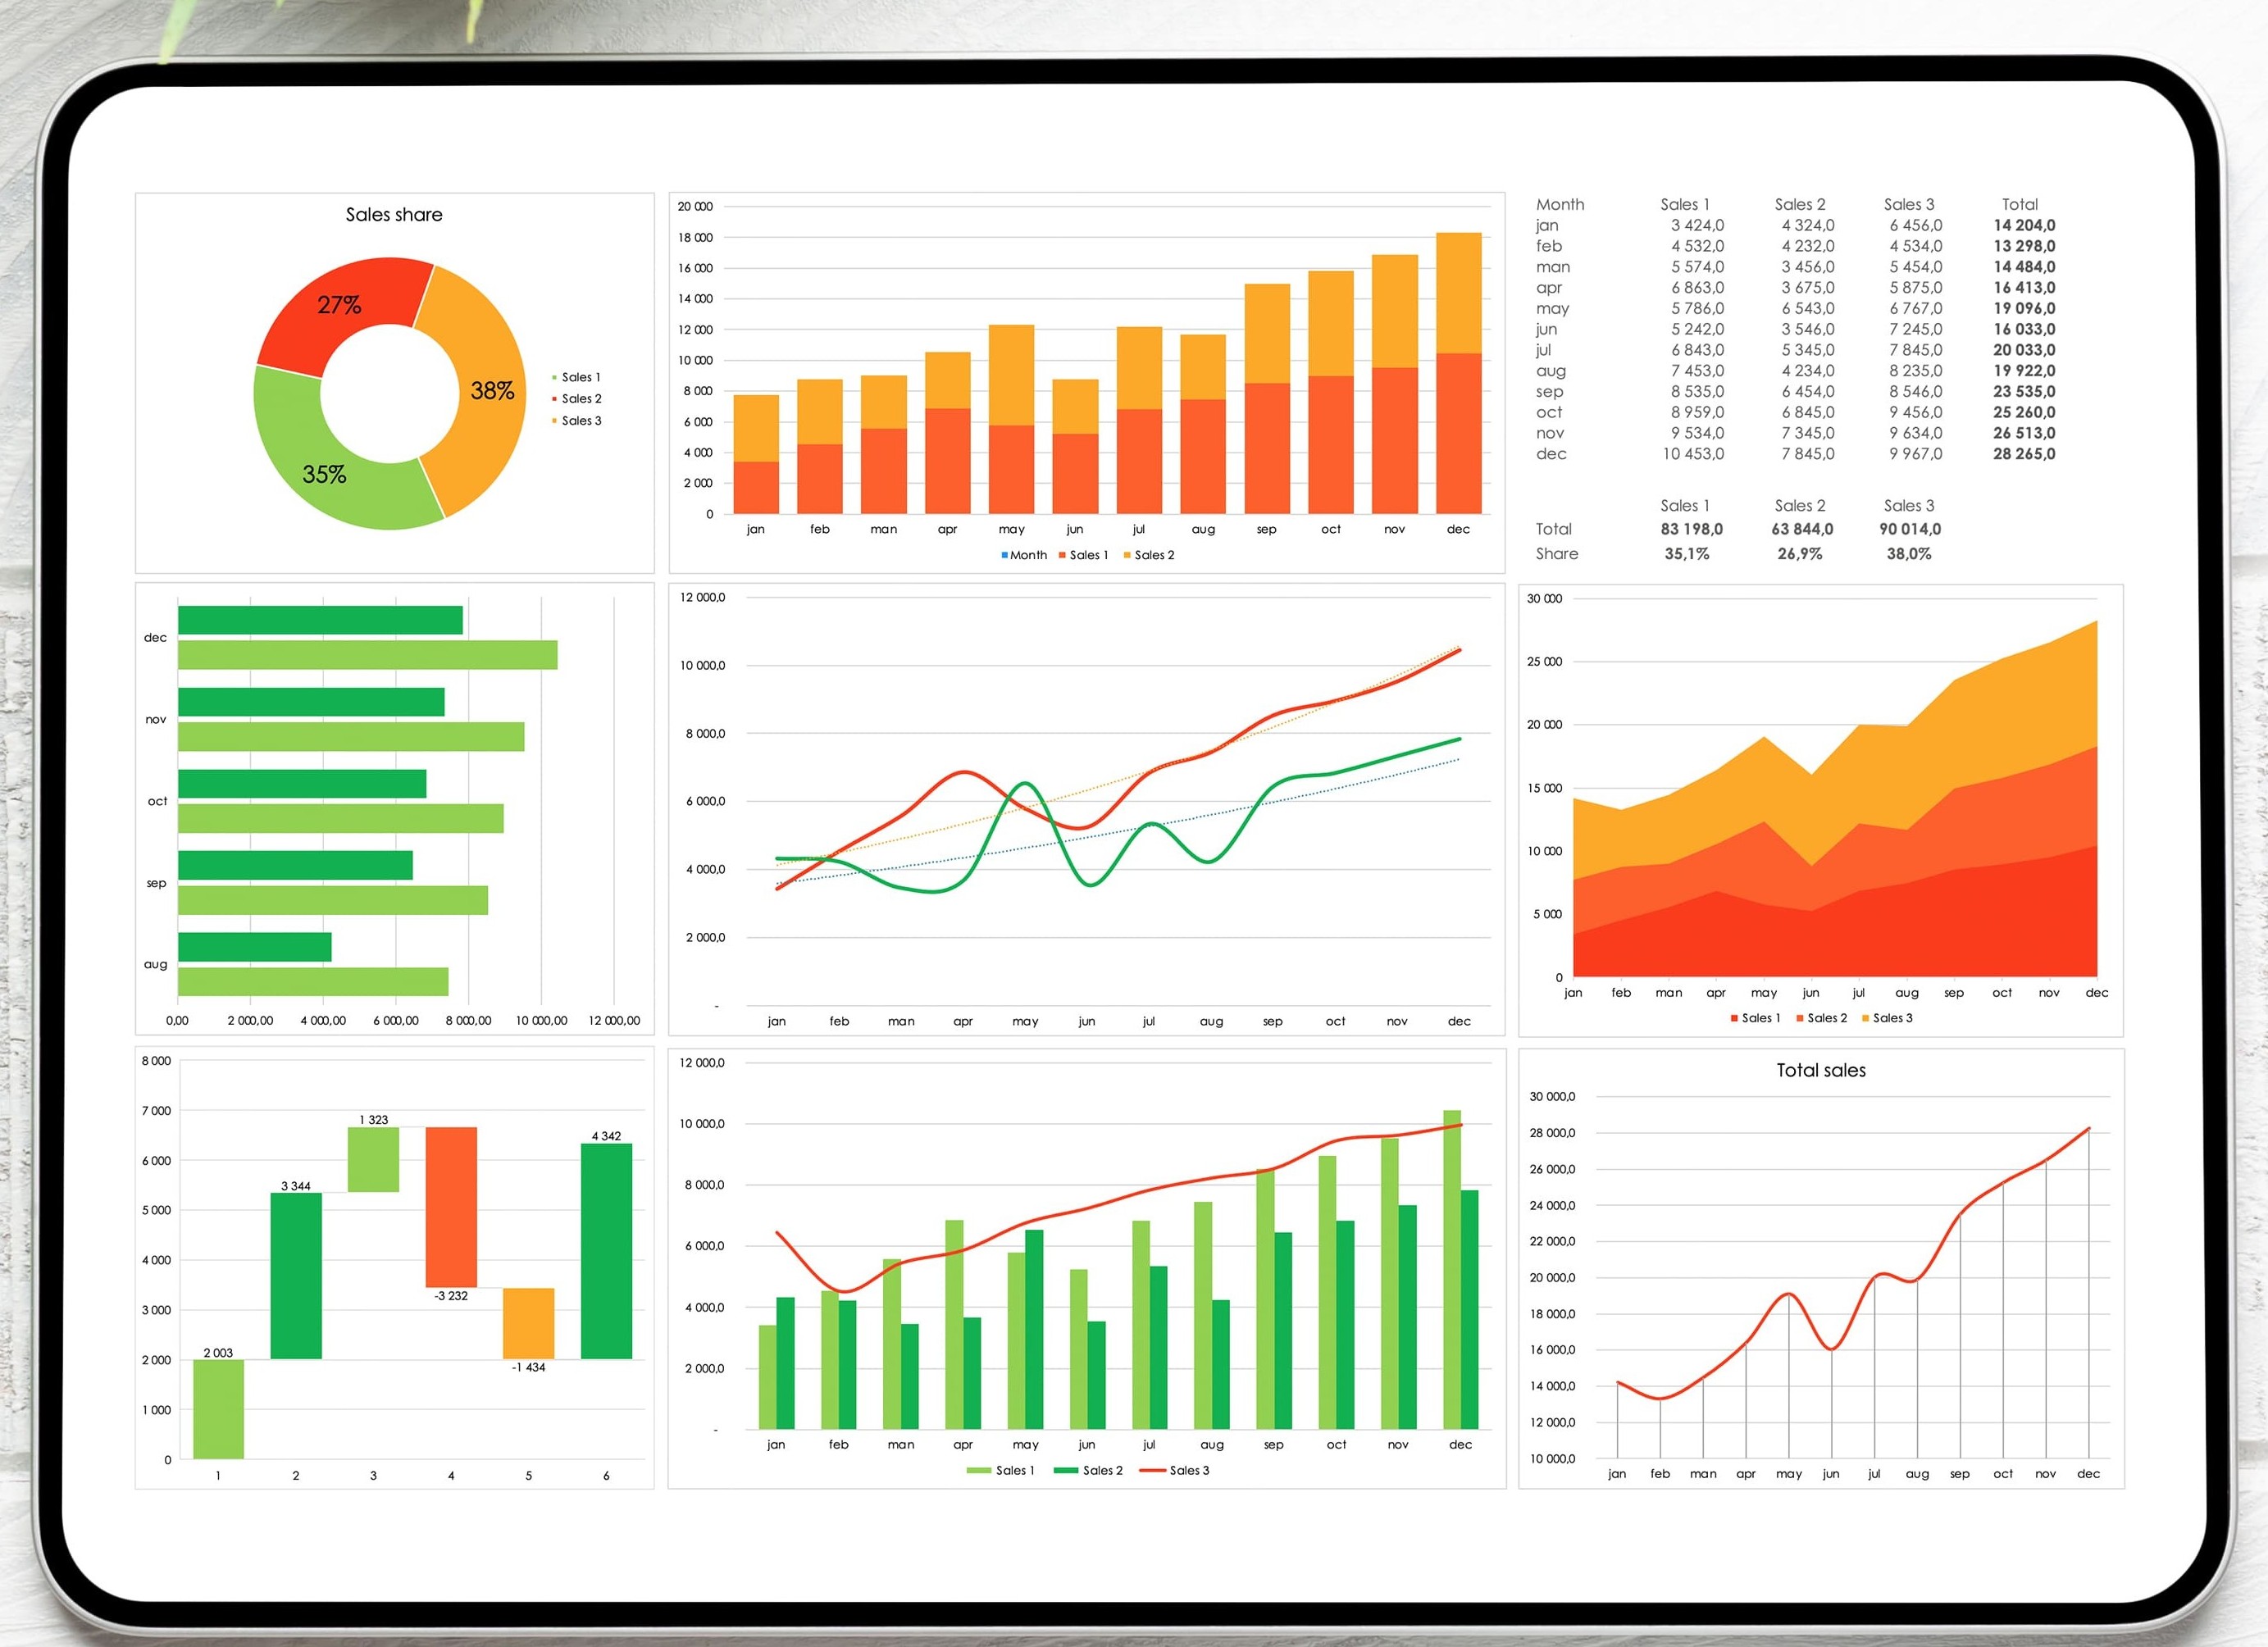
ETL and data integration from multiple sources

We take care of the hard work of combining messy, different datasets into a single visualization schema.

The Tech: We make custom API connectors and automated FTP pipelines that pull data from survey platforms like Forsta, Qualtrics, and Decipher, as well as from internal CRMs like Salesforce and HubSpot and third-party social listening tools.

The Result: You get a complete picture of the market. You can now connect "intent" data from a survey with "behavioral" data from the real world.

02

Real-Time "Drill-Down" and Segment Interrogation

Users can change the direction of data right away with our dashboards. You won't have to wait for a DP team to do a manual re-tabulation anymore.

The Tech: We use dynamic cross-tabulation logic and global filtering. You can change things like Persona, Region, NPS, or Wave to change the whole visual ecosystem in a matter of seconds.

The Result: It makes it easier for your stakeholders to do "What-If" analysis on their own. [Insert Personal Anecdote Here]. It makes it much easier for your internal team to handle ad-hoc data requests.

03

Automated Benchmarking and Significance

We put statistical guardrails right into the UI. This stops stakeholders from looking for ghosts in the data.

The Technology: We add automated Significance Testing (Z-tests and T-tests) to the dashboard. We use visual cues, such as arrows in different colors, to show changes that are really important compared to historical benchmarks.

The Result: It stops people from reading too much into statistical noise. You make sure that decisions are only based on trends that have been checked.

04

Text and Sentiment Analysis of Qualitative Data

We add "The Why" to the quantitative dashboard so that the context is still clear.

The Tech: Using NLP to make Word Clouds, Sentiment Heatmaps, and Verbatim Search. We put open-ended answers into dynamic themes that change as you filter the quantitative segments.

The Result: This gives consultants the "story" behind the KPIs, which lets them see everything that is really driving the respondent.

05

Access by Role and Safe Distribution

When you put a dashboard in a global company, security is the most important thing.

The Tech: Setting up Role-Based Access Controls (RBAC) and Row-Level Security (RLS). This makes sure that a regional manager only sees their area, while the C-suite sees the whole world.

The Result: It keeps data safe and private. The right information gets to the right people and no one else.

06

Executive Summaries That Work on Mobile

You should be able to get to important KPIs from anywhere. We put mobile-first design first so that leaders can work on the go.

The Tech: D3.js, Tableau, or PowerBI Mobile frameworks for responsive design. We make sure that the "North Star" metrics are always at the top of the layout hierarchy, even on a small screen.

The Outcome: Stakeholders are more involved. You're giving executive leadership direct access to high-impact insights.

Platforms and Technical Infrastructure

We don't have a favorite software; we use the one that works best for our method:

Dashboard stack and infrastructure
Main Platforms: Tableau, PowerBI, Dapresy, and Forsta Visualizations.
Custom Development: We use JavaScript (Highcharts/D3.js) to make custom visualizations that off-the-shelf tools can't do.
Data Refresh: You can choose to sync data in real time, every day, every week, or in waves.

Give your clients real-time information to help them.

Work with Mindforce Research to create a dashboard ecosystem that makes complicated research a competitive edge.

Hi! Hope you are having a good day!

Can you please help us with your query, name, email id and contact number with country code? Our support Agent will get back to you on mail.

now